| Model No. | Nomenclature | Genotype |
|---|---|---|
| SHR | NTac:SHR |
Spontaneously Hypertensive
View:
Select One
- Description
- Related Products & Services
- Data
- Growth Chart
- Price & Licensing
- Overview
- Genetics
- Guides & Publications
- Applications & Therapeutic Areas
- Transit, Housing & Welfare
- Diet
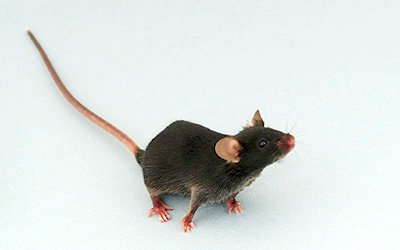
Overview
Nomenclature: NTac:SHR
- Derived from the Okamoto-Aoki Strain
- Males exhibit average systolic blood pressures greater than 200 mmHg by 3-4 months of age
- The SHR is generally used for studies in hypertension and cardiovascular research
- Based on historical usage, the SHR has outbred nomenclature NTac:SHR. However, genetic testing has shown that this colony is homozygous at all alleles tested (inbred). Taconic maintains the SHR through random breeding in a closed colony.
Origin
Genetics
Guides & Publications
Applications & Therapeutic Areas
- Cardiovascular Disease
Transit, Housing & Welfare
Need more info? Click the live chat button or Contact Us
Diet
- Services
Data
Average litter size: 7
Loading...
n= 200 per sex at the MPF health standard from US colonies. Data collected 2008-12.
High and Low represent mean +/- 2 standard deviations.
Based on sample size the charts above represents ~95% of the population.
All growth curves represent animals housed in our barriers, at our standard density and fed NIH31-M diet. Variations at customer facilities will alter expected growth curves. Growth charts are provided only as a guide, if a specific weight criteria is needed please order animals by weight.
- Select my Health Standard
- Get Custom Pricing Guide
Select my Health Standard
Need help choosing the right Taconic Biosciences health standard for your research?
Use the Health Standard Selector to enter your exclusion list. The tool will tell you which health standards meet your requirements.
Get custom pricing guide
Schedule A Scientific Consultation
Connect directly with a member of our Scientific Solutions team who can help you select the most appropriate model and maximize your experimental success.








.jpg)

.jpg)
.jpg)
.jpg)
.jpg)


.jpg)


.jpg)
.jpg)


.jpg)



.jpg)

.jpg)


