| Model No. | Nomenclature | Genotype |
|---|---|---|
| NOD-F | NOD/MrkTac | |
| NOD-M | NOD/MrkTac |
NOD

View:
Select One
- Description
- Related Products & Services
- Data
- Growth Chart
- Price & Licensing
- Health Report
- Overview
- Genetics
- Guides & Publications
- Applications & Therapeutic Areas
- Transit, Housing & Welfare
- Diet
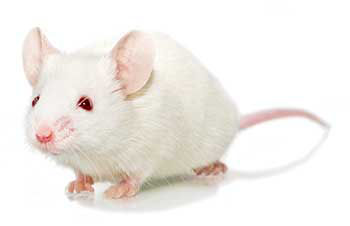
Overview
Nomenclature: NOD/MrkTac
- Exhibits destructive autoimmune pancreatic insulitis as early as four weeks of age
- Diabetes incidence varies in this model based on a number of factors, including microbiome. The most recent phenotype monitoring data is posted below under Phenotypic Data. Phenotype can vary based on husbandry conditions, and Taconic cannot guarantee disease onset or incidence.
Availability
This model is not available to deliver at greater than 9 weeks of age for welfare reasons.Origin
Genetics
Guides & Publications
Applications & Therapeutic Areas
- Diabetes
- Immunology
- Inflammation
- Metabolic Disease
- Microbiome
Transit, Housing & Welfare
Need more info? Click the live chat button or Contact Us
Packing Practices
Taconic standard practice is to recombine animals of different home cages and/or ages from a single model and sex during packing, except in specific cases where Taconic's animal welfare policy prohibits recombination due to aggression or other concerns. When an order is fulfilled with animals from more than one week of birth, this standard practice results in animals from a range of birth weeks packed together in a single TTC. When an order is fulfilled with animals from genotyped models, this standard practice results in animals from different home cages packed together in a single TTC.
Customers who wish to keep animals from different weeks of birth separated should place orders with the special instruction "Divide and label by age." Note that this special request can result in increased costs for additional Taconic Transit Cages, dividers and/or freight charges.
Taconic discourages other types of custom packing requests as they can have a negative impact on animal welfare. Learn more.
Diet
- Services

Data
Average litter size: 9
2022 Diabetes Incidence in NOD Production Colony (IBU34)
")
Taconic assessed diabetes incidence via urine analysis. Fresh urine was collected and applied to a Diastix test strip. Test strip results of ≥250 mg/dl of glucose in urine were considered diabetic. Results below 250 mg/dl were considered non-diabetic.
Data on diabetes onset and incidence in the NOD production colony is based on a snapshot in time. Diabetes phenotype in NOD mice may be affected by microbiome and other factors. Taconic cannot guarantee phenotypic performance.
NOD Physiological Data Summary (July 2004; N=10/group):
| Parameter | Units | NOD Males | NOD Females |
|---|---|---|---|
| Serum Chemistry | Avg ± S.D. | ||
| Calcium | mg/dL | 10.6 ± 0.6 | 11.1 ± 0.3 |
| Phosphorous | mg/dL | 11.8 ± 2.0 | 10.2 ± 3.6 |
| Glucose | mg/dL | 116 ± 18 | 88 ± 17 |
| Creatinine | mg/dL | 0.1 ± 0.0 | 0.1 ± 0.1 |
| BUN | mg/dL | 22 ± 2 | 17 ± 6 |
| Total Bilirubin | mg/dL | 0.2 ± 0.1 | 0.1 ± 0.0 |
| ALK | U/L | 180 ± 11 | 184 ± 21 |
| ALT U/L | U/L | 67 ± 63 | 44 ± 11 |
| Total Protein | g/dL | 6.1 ± 0.6 | 6.2 ± 0.1 |
| Blood Counts | |||
| Erythron | |||
| Red Blood Cells | X10^6/uL | 8.54 ± 0.575 | 8.955 ± 0.476 |
| Nucleated RBC | X10^6/uL | 0 ± 0 | 0 ± 0 |
| Hemoglobin | g/dL | 15.2 ± 0.5 | 15.1 ± 0.7 |
| Hematocrit | % | 46.7 ± 3.5 | 46.2 ± 2.5 |
| MCV | fL | 55 ± 1 | 52 ± 0 |
| MCH | pG | 17.8 ± 1.0 | 16.9 ± 0.2 |
| MCHC | % | 32.7 ± 2.1 | 32.7 ± 0.4 |
| Platelets | |||
| Platelets | X10^3/uL | 1165 ± 334 | 1127 ± 291 |
| Leukogram | |||
| White Blood Cells | x10^3/uL | 3.654 ± 0.875 | 5.438 ± 1.234 |
| Neutrophil | x10^3/uL | 1.211 ± 0.326 | 2.011 ± 0.872 |
| Bands | x10^3/uL | 0 ± 0 | 0 ± 0 |
| Lymphocyte | x10^3/uL | 2.400 ± 0.999 | 3.380 ± 1.139 |
| Monocytes | x10^3/uL | 0.039 ± 0.068 | 0.016 ± 0.030 |
| Eosinophil | x10^3/uL | 0.003 ± 0.010 | 0.031 ± 0.063 |
| Basophils | x10^3/uL | 0 ± 0 | 0 ± 0 |
| Others | x10^3/uL | 0 ± 0 | 0 ± 0 |
| Organ Weights | |||
| Stomach | g | 0.275 ± 0.016 | 0.257 ± 0.025 |
| Ileum | g | 0.791 ± 0.062 | 0.799 ± 0.098 |
| Colon | g | 0.206 ± 0.042 | 0.192 ± 0.050 |
| Lungs | g | 0.228 ± 0.024 | 0.226 ± 0.025 |
| Heart | g | 0.174 ± 0.032 | 0.136 ± 0.017 |
| Liver | g | 1.139 ± 0.072 | 0.955 ± 0.076 |
| Spleen/Pancreas | g | 0.228 ± 0.032 | 0.193 ± 0.027 |
| Kidney (L) | g | 0.204 ± 0.017 | 0.137 ± 0.011 |
| Kidney (R) | g | 0.204 ± 0.017 | 0.138 ± 0.013 |
| Testes (L) | g | 0.103 ± 0.008 | - |
| Testes (R) | g | 0.189 ± 0.268 | - |
| Ovary (L) | g | - | 0.020 ± 0.008 |
| Ovary (R) | g | - | 0.021 ± 0.012 |
| Urinalysis | |||
| Glucose | mg/dL | Negative | Negative |
| Blood | - | Negative | Negative |
| PH | - | 6.85 ± 0.41 | 6.45 ± 0.16 |
| Protein | mg/dL | Negative | Negative |
| Specific Gravity | - | 1.01 ± 0.01 | 1.02 ± 0.00 |
Phenotyping Procedures:
Animal Receipt and Maintenance
A quantity of twenty mice (ten males and ten females) was submitted for testing, strain identified as Line NOD (NOD/MrkTac), age 7 weeks. Mice were received at RBU 3, Taconic Biotechnology, Albany NY and acclimated for three days on irradiated NIH31 diet and sterilized water ad lib, sterile contact bedding (paper chip) and a 12:12 light:dark cycle. All animals appeared normal during this period and routine health surveillance of this colony detected no microbial pathogens. Mice were assigned study unique identification numbers (males 1-10, females 11-20).
Urinalysis
All mice were fasted in metabolic cages and an overnight urine sample was collected. Urine analysis was performed using Multistix 10 SG (Bayer). Strips were read and recorded as per the manufacturer's instructions, and the results are presented in Table 2.
Clinical Chemistry and Hematology
A terminal blood sample was taken from Carbon Dioxide - anesthetized mice via cardiac puncture. The collected blood was divided into two samples. One sample was treated with EDTA and stored at 4°C for hematological evaluation. Another sample was allowed to clot at 4°C for 30 minutes, and then centrifuged at 7000rpm for 10 minutes, and the serum was decanted and frozen at -80°C for clinical chemistry analysis. A slide smear was made from a single drop of whole blood. Frozen serum, chilled whole blood and slides were delivered to LabCorp (RTP, NC) for analysis; the results are presented in Table 3. Unless otherwise indicated, serum chemistry data is generated from a Hitachi 717 automated analyzer and hematological data is generated from a Celldyne 3500. WBC differential counts are performed manually.
Necropsy and Organ Weights
All mice were euthanized and bodyweights were recorded. Representative tissues were collected, weighed, and immersion fixed in 10% Neutral Buffered Formalin. Tissues were delivered to the Taconic lab for histological preparation and evaluation. Tabulation of organ weights is presented in Table 4. The pathologist's summary and detailed histological descriptions follow.
Discussion
All animals were thrifty on arrival and appeared clinically normal. Locomotor behavior was normal and there were no visible lesions or discharges at the mucous membranes. All tissues appeared normal on gross necropsy evaluation and weights were within normal limits. There were no unusual findings upon collection of these tissues nor otherwise observed in the body cavities.
The overall profile of these mice is consistent with expectations of a general-purpose mouse. None of the parameters are indicative of impaired system function.
For some applications, weight may be critical. For orders where weight is critical, please place orders by weight, not by age. Taconic can accept orders by weight for this model. For orders sourced from US or Denmark a production minimum 3 gram span is accepted. All weights are weights at time of packing. Mice and rats can lose weight in transit. Orders for specific weight spans will be assessed a nominal fee. More detail on weight order policies is available.
Loading...
n= 150 per sex at MPF, health standard from all global colonies. Data collected 2012-15.
High and Low represent mean +/- 2 standard deviations.
Based on sample size the charts above represents ~90% of the population.
All growth curves represent animals housed in our barriers, at our standard density and fed NIH31-M diet. Variations at customer facilities will alter expected growth curves.
Growth charts are provided only as a guide.
Customize this chart by clicking the legend elements.
- Licensing
- Pricing - USD
- Pricing - EUR
- Pricing - DKK
- Pricing - USD Nonprofit
- Pricing - EUR Nonprofit
- Pricing - DKK Nonprofit
- Select my Health Standard
- Get Custom Pricing Guide
Licensing
Terms of Sale and Use for NOD
These models are sold subject to Taconic's Terms and Conditions for Taconic's Models, Products and Services
Pricing - USD
Opportunist Free (OF) Health Standard
NOD Female
NOD-F
Available now
| Age in Weeks | Quantity 1 - 999 |
|---|---|
| 3 to 4 | US$92.00 |
| 5 to 7 | US$116.00 |
| 8 to 9 | US$140.00 |
NOD Male
NOD-M
Cohorts are reserved upon order placement and will take 2-4 weeks to fulfill. An estimated lead time will be provided to you within 2-3 business days.
| Age in Weeks | Quantity 1 - 999 |
|---|---|
| 3 to 4 | US$80.00 |
| 5 to 7 | US$97.00 |
| 8 to 9 | US$115.00 |
Pricing - EUR
Opportunist Free (OF) Health Standard
NOD Female
NOD-F
Available now
| Age in Weeks | Quantity 1 - 999 |
|---|---|
| 3 to 4 | 83,00 € |
| 5 to 7 | 105,00 € |
| 8 to 9 | 127,00 € |
NOD Male
NOD-M
Cohorts are reserved upon order placement and will take 2-4 weeks to fulfill. An estimated lead time will be provided to you within 2-3 business days.
| Age in Weeks | Quantity 1 - 999 |
|---|---|
| 3 to 4 | 72,00 € |
| 5 to 7 | 88,00 € |
| 8 to 9 | 105,00 € |
Pricing - DKK
Opportunist Free (OF) Health Standard
NOD Female
NOD-F
Available now
| Age in Weeks | Quantity 1 - 999 |
|---|---|
| 3 to 4 | kr.619,00 |
| 5 to 7 | kr.785,00 |
| 8 to 9 | kr.945,00 |
NOD Male
NOD-M
Cohorts are reserved upon order placement and will take 2-4 weeks to fulfill. An estimated lead time will be provided to you within 2-3 business days.
| Age in Weeks | Quantity 1 - 999 |
|---|---|
| 3 to 4 | kr.539,00 |
| 5 to 7 | kr.657,00 |
| 8 to 9 | kr.779,00 |
Pricing - USD Nonprofit
Opportunist Free (OF) Health Standard
NOD Female
NOD-F
Available now
| Age in Weeks | Quantity 1 - 999 |
|---|---|
| 3 to 4 | US$92.00 |
| 5 to 7 | US$116.00 |
| 8 to 9 | US$140.00 |
NOD Male
NOD-M
Cohorts are reserved upon order placement and will take 2-4 weeks to fulfill. An estimated lead time will be provided to you within 2-3 business days.
| Age in Weeks | Quantity 1 - 999 |
|---|---|
| 3 to 4 | US$80.00 |
| 5 to 7 | US$97.00 |
| 8 to 9 | US$115.00 |
Pricing - EUR Nonprofit
Opportunist Free (OF) Health Standard
NOD Female
NOD-F
Available now
| Age in Weeks | Quantity 1 - 999 |
|---|---|
| 3 to 4 | 83,00 € |
| 5 to 7 | 105,00 € |
| 8 to 9 | 127,00 € |
NOD Male
NOD-M
Cohorts are reserved upon order placement and will take 2-4 weeks to fulfill. An estimated lead time will be provided to you within 2-3 business days.
| Age in Weeks | Quantity 1 - 999 |
|---|---|
| 3 to 4 | 72,00 € |
| 5 to 7 | 88,00 € |
| 8 to 9 | 105,00 € |
Pricing - DKK Nonprofit
Opportunist Free (OF) Health Standard
NOD Female
NOD-F
Available now
| Age in Weeks | Quantity 1 - 999 |
|---|---|
| 3 to 4 | kr.619,00 |
| 5 to 7 | kr.785,00 |
| 8 to 9 | kr.945,00 |
NOD Male
NOD-M
Cohorts are reserved upon order placement and will take 2-4 weeks to fulfill. An estimated lead time will be provided to you within 2-3 business days.
| Age in Weeks | Quantity 1 - 999 |
|---|---|
| 3 to 4 | kr.539,00 |
| 5 to 7 | kr.657,00 |
| 8 to 9 | kr.779,00 |
Select my Health Standard
Need help choosing the right Taconic Biosciences health standard for your research?
Use the Health Standard Selector to enter your exclusion list. The tool will tell you which health standards meet your requirements.
Get custom pricing guide

Schedule A Scientific Consultation
Connect directly with a member of our Scientific Solutions team who can help you select the most appropriate model and maximize your experimental success.