Oncology: Cell Proliferation
Taconic does not currently perform this phenotypic assay. Oncogene targets that have a direct effect on cell cycle, DNA repair or apoptosis can manifest their function through changes in adult skin fibroblast proliferation. Punch biopsies are taken of skin samples from the backs of mutant mice and cohort controls. These are developed into primary fibroblast cultures and the fibroblast proliferation rates are measured in a strictly controlled protocol. The ability of this assay to detect hyperproliferative and hypoproliferative phenotypes has been demonstrated with p53 (Jones SN, et al., 1996) and Ku80 (unpublished results).
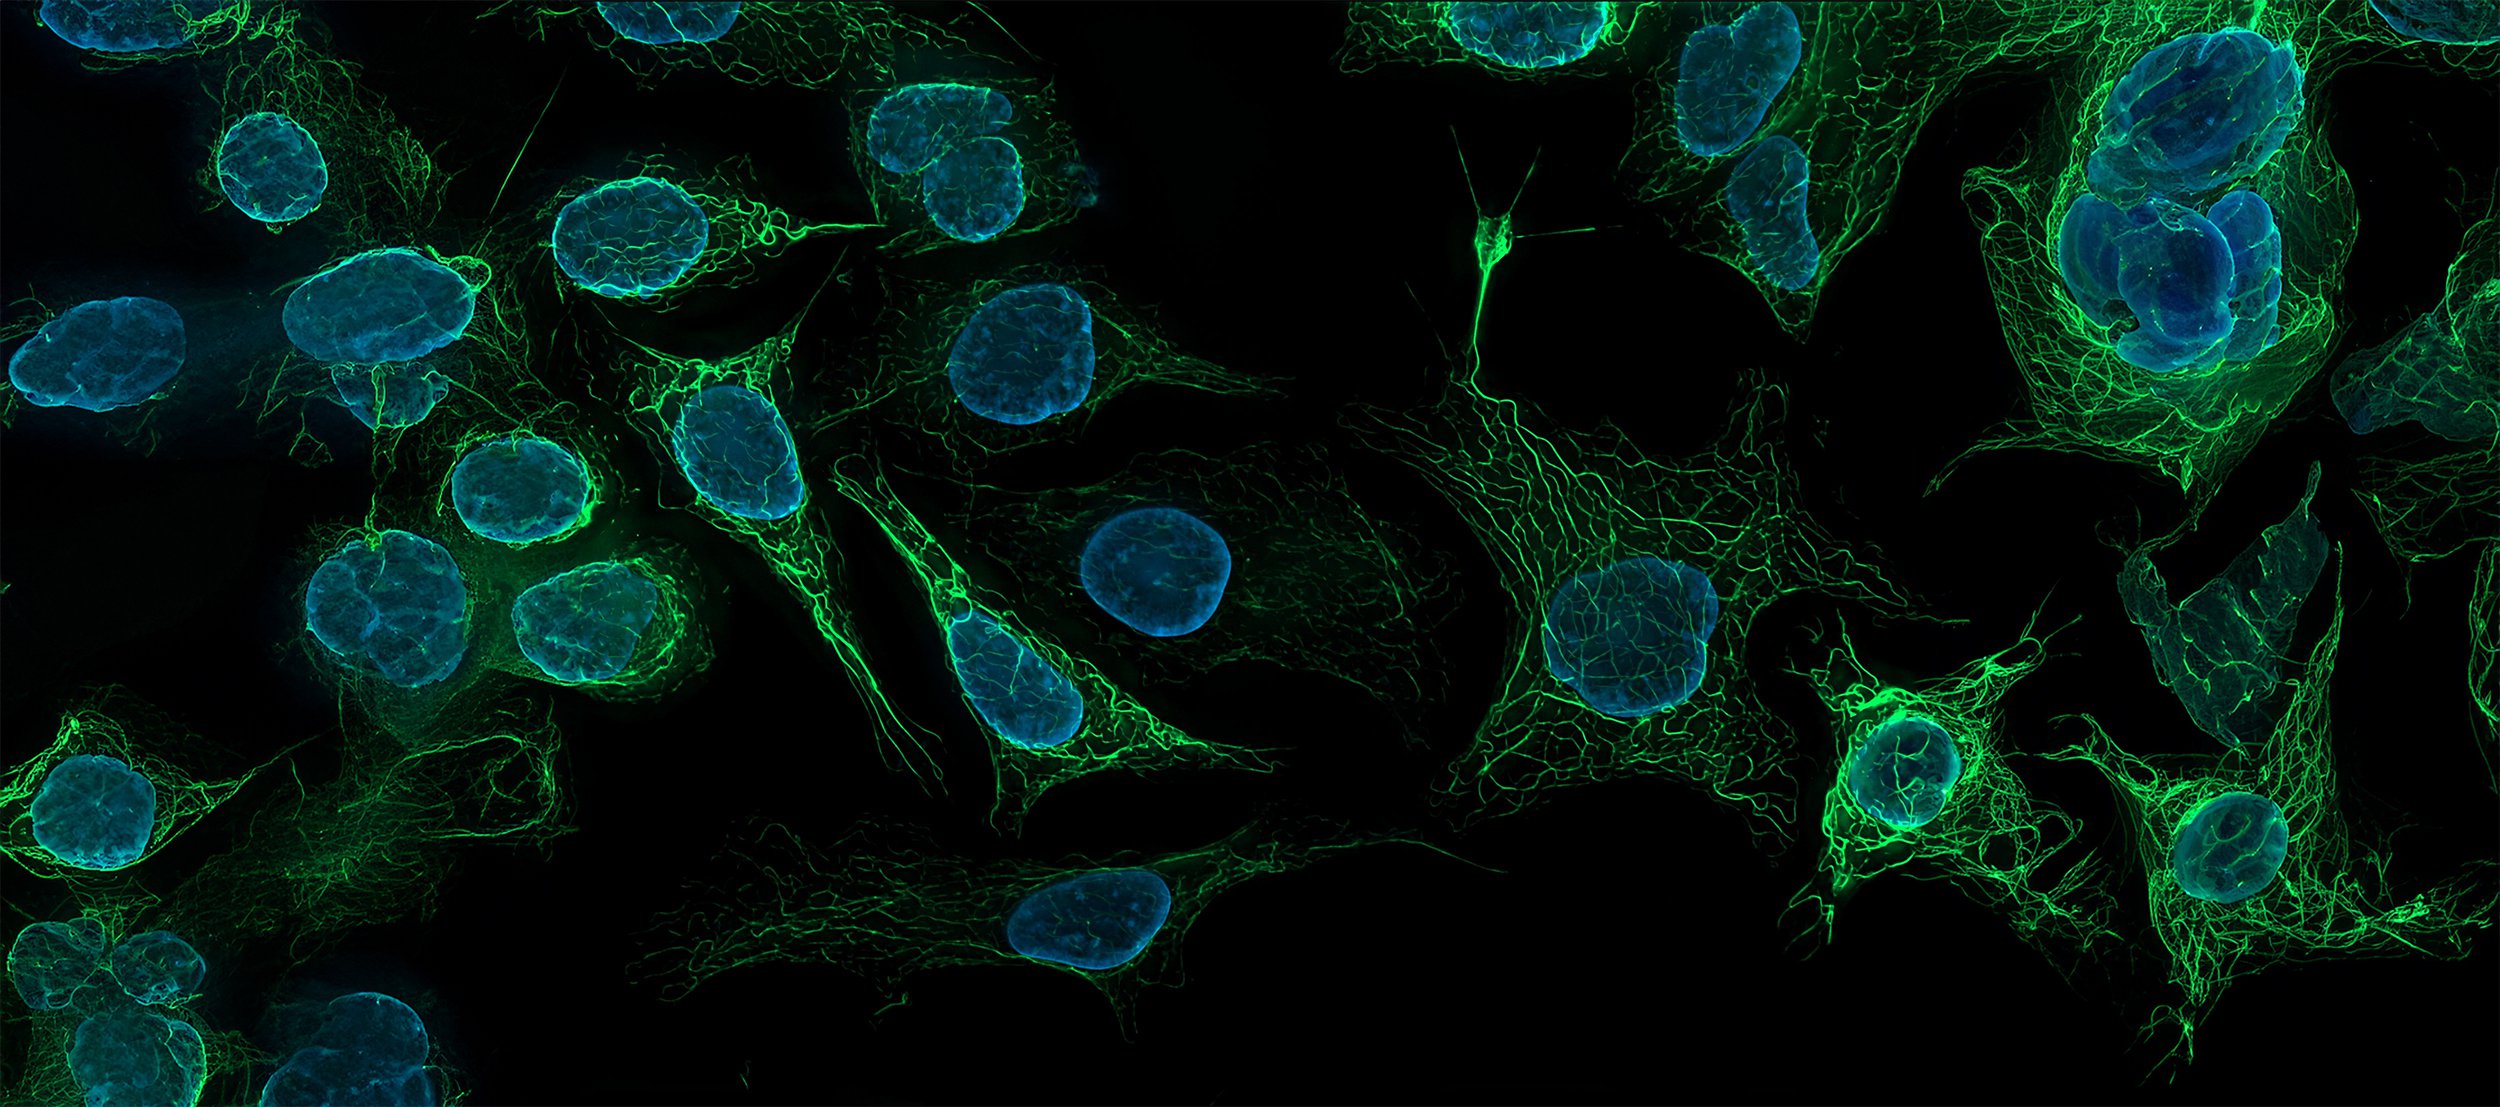
The skin fibroblast proliferation assay uses the increase in the number of cells in a standardized culture as a measure of relative proliferative capacity. Primary fibroblasts are established from skin biopsies taken from wild type and mutant mice. Duplicate or triplicate cultures of 0.05 million cells are plated and allow to grow for six days. At the end of the culture period, the number of cells present in the culture is determined using an electronic particle counter.
Displayed below is a sample graph of how cell proliferation results are presented. In comprehensive phenotypic data packages graphs are interactive. Raw or calculated data and statistics can be seen by clicking on points in the graph.












.jpg)

.jpg)
.jpg)
.jpg)
.jpg)




.jpg)


.jpg)
.jpg)



.jpg)



.jpg)

.jpg)


