| Model No. | Nomenclature | Genotype |
|---|---|---|
| BALBNU | C.Cg/AnNTac-Foxn1nu NE9 | sp/sp |
| BALBNU-M | C.Cg/AnNTac-Foxn1nu NE9 | sp/sp |
| BALBNU-F | C.Cg/AnNTac-Foxn1nu NE9 | sp/wt |
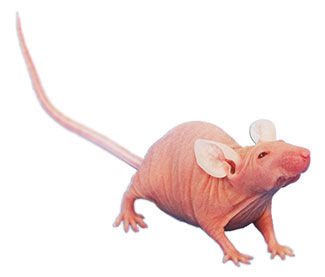
BALB/c nude
View:
Select One
- Description
- Data
- Growth Chart
- Price & Licensing
- Overview
- Genetics
- Guides & Publications
- Applications & Therapeutic Areas
- Transit, Housing & Welfare
- Diet
Overview
Nomenclature: C.Cg/AnNTac-Foxn1nu NE9
- Foxn1nu mutation backcrossed to the BALB/cAnNTac inbred strain for equivalent of nine generations
- The deficiency in T cell function allows athymic mice to accept and grow xenografts as well as allografts of normal and malignant tissues. Tissues from the BALB/c Nude can be transplanted onto normal BALB/c mice.
- The autosomal recessive nude gene in homozygous (sp/sp) mice causes the lack of fur and an abnormal thymus. The deficiency in T cell function allows athymic mice to accept and grow xenografts as well as allografts of normal and malignant tissues.
- Heterozygous (sp/wt) mice carry only one copy of the nude mutation and have hair. Heterozygous nudes were originally thought to have normal immune systems, but in fact have immune alterations such as reduced bone marrow stem cells and lower thymus weights. Heterozygous nudes may thus not be appropriate for use as sentinels. They may be used in PK/dosing studies.
Availability
Available for immediate cryorecovery.Origin
Genetics
Guides & Publications
Applications & Therapeutic Areas
- Immunology
- Oncology & Immuno-Oncology
- Inflammation
Transit, Housing & Welfare
Need more info? Click the live chat button or Contact Us
Diet
Data
Average litter size: 7
Loading...
- Select my Health Standard
- Get Custom Pricing Guide
Select my Health Standard
Need help choosing the right Taconic Biosciences health standard for your research?
Use the Health Standard Selector to enter your exclusion list. The tool will tell you which health standards meet your requirements.
Get custom pricing guide

Schedule A Scientific Consultation
Connect directly with a member of our Scientific Solutions team who can help you select the most appropriate model and maximize your experimental success.