| Model No. | Nomenclature | Genotype |
|---|---|---|
| 4007-F | B6.SJL-Ptprca/BoyAiTac | sp/sp |
| 4007-M | B6.SJL-Ptprca/BoyAiTac | sp/sp |
B6.SJL
View:
Select One
- Description
- Related Products & Services
- Data
- Growth Chart
- Price & Licensing
- Health Report
- Overview
- Genetics
- Guides & Publications
- Applications & Therapeutic Areas
- Transit, Housing & Welfare
- Diet
Overview
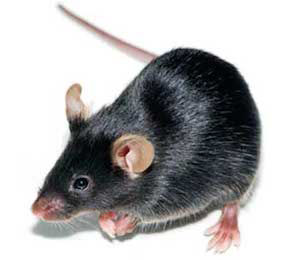
Nomenclature: B6.SJL-Ptprca/BoyAiTac
- Genetically similar to the C57BL/NTac strain except that it carries the Ptprca allele (protein-tyrosine phosphatase, receptor type c locus previously known as CD45.1, Ly5.1) and the Pep3b allele from the SJL/J strain
- The unique lymphocyte cell surface antigen produced by Ptprca makes this strain useful for immunological adoptive transfer experiments and useful as a background for transgenic and knockout models used in adoptive transfer studies
- Backcrossed to the C57BL/6NTac strain to NE8 as assessed by SNP testing.
Origin
The B6.SJL Congenic model was developed by Boyse et al in 1975 by intercrossing C57BL/6Boy mice to SJL/J mice. Taconic received stock from the NIAID in 1995. The mice were derived by embryo transfer into the NIAID Transgenic Mouse Repository. The mice were backcrossed by Boyse to a C57BL/6Boy inbred background to select for SJL antigen type (now referred to as Ptprca or Ly5.1). Refreshed in 2007 from NIAID stock. Further backcrossed to the C57BL/6NTac background to NE8.
Genetics
Guides & Publications
Applications & Therapeutic Areas
- Autoimmune Disease
- Immunology
- Infectious Disease
- Inflammation
- Microbiome
- Model Generation Solutions
- Oncology & Immuno-Oncology
- Reporter Lines
Transit, Housing & Welfare
Need more info? Click the live chat button or Contact Us
Packing Practices
Taconic standard practice is to recombine animals of different home cages and/or ages from a single model and sex during packing, except in specific cases where Taconic's animal welfare policy prohibits recombination due to aggression or other concerns. When an order is fulfilled with animals from more than one week of birth, this standard practice results in animals from a range of birth weeks packed together in a single TTC. When an order is fulfilled with animals from genotyped models, this standard practice results in animals from different home cages packed together in a single TTC.
Customers who wish to keep animals from different weeks of birth separated should place orders with the special instruction "Divide and label by age." Note that this special request can result in increased costs for additional Taconic Transit Cages, dividers and/or freight charges.
Taconic discourages other types of custom packing requests as they can have a negative impact on animal welfare. Learn more.
Diet
- Services

Data
Average litter size: 5
For some applications, weight may be critical. For orders where weight is critical, please place orders by weight, not by age. Taconic can accept orders by weight for this model. For orders sourced from US or Denmark a production minimum 3 gram span is accepted. All weights are weights at time of packing. Mice and rats can lose weight in transit. Orders for specific weight spans will be assessed a nominal fee. More detail on weight order policies is available.
Loading...
n= 50 per sex at MPF health standards from US colonies. Data collected 2012-13.
High and Low represent mean +/- 1 standard deviation.
Based on sample size the charts above represents ~65% of the population.
All growth curves represent animals housed in our barriers, at our standard density and fed NIH31-M diet. Variations at customer facilities will alter expected growth curves.
Growth charts are provided only as a guide, if a specific weight criteria is needed please order animals by weight.
Customize this chart by clicking on the legend elements.
- Licensing
- Pricing - USD
- Pricing - EUR
- Pricing - DKK
- Pricing - USD Nonprofit
- Pricing - EUR Nonprofit
- Pricing - DKK Nonprofit
- Select my Health Standard
- Get Custom Pricing Guide
Licensing
Terms of Sale and Use for B6.SJL
These models are sold subject to Taconic's Terms and Conditions for Taconic's Models, Products and Services
Pricing - USD
Murine Pathogen Free (MPF) Health Standard
4007 Female
4007-F Genotype sp/sp
Pilot-sized cohorts are readily available. Large cohort requests have a minimum 8-week lead time. An estimated lead time will be provided to you within 2-3 business days.
| Age in Weeks | Quantity 1 - 999 |
|---|---|
| 3 to 4 | US$80.00 |
| 5 to 7 | US$96.00 |
| 8 to 10 | US$120.50 |
4007 Male
4007-M Genotype sp/sp
Pilot-sized cohorts are readily available. Large cohort requests have a minimum 8-week lead time. An estimated lead time will be provided to you within 2-3 business days.
| Age in Weeks | Quantity 1 - 999 |
|---|---|
| 3 to 4 | US$80.00 |
| 5 to 7 | US$96.00 |
| 8 to 10 | US$120.50 |
Pricing - EUR
Murine Pathogen Free (MPF) Health Standard
4007 Female
4007-F Genotype sp/sp
Pilot-sized cohorts are readily available. Large cohort requests have a minimum 8-week lead time. An estimated lead time will be provided to you within 2-3 business days.
| Age in Weeks | Quantity 1 - 999 |
|---|---|
| 3 to 4 | 71,75 € |
| 5 to 7 | 86,50 € |
| 8 to 10 | 108,75 € |
4007 Male
4007-M Genotype sp/sp
Pilot-sized cohorts are readily available. Large cohort requests have a minimum 8-week lead time. An estimated lead time will be provided to you within 2-3 business days.
| Age in Weeks | Quantity 1 - 999 |
|---|---|
| 3 to 4 | 71,75 € |
| 5 to 7 | 86,50 € |
| 8 to 10 | 108,75 € |
Pricing - DKK
Murine Pathogen Free (MPF) Health Standard
4007 Female
4007-F Genotype sp/sp
Pilot-sized cohorts are readily available. Large cohort requests have a minimum 8-week lead time. An estimated lead time will be provided to you within 2-3 business days.
| Age in Weeks | Quantity 1 - 999 |
|---|---|
| 3 to 4 | kr.534,25 |
| 5 to 7 | kr.644,00 |
| 8 to 10 | kr.808,75 |
4007 Male
4007-M Genotype sp/sp
Pilot-sized cohorts are readily available. Large cohort requests have a minimum 8-week lead time. An estimated lead time will be provided to you within 2-3 business days.
| Age in Weeks | Quantity 1 - 999 |
|---|---|
| 3 to 4 | kr.534,25 |
| 5 to 7 | kr.644,00 |
| 8 to 10 | kr.808,75 |
Pricing - USD Nonprofit
Murine Pathogen Free (MPF) Health Standard
4007 Female
4007-F Genotype sp/sp
Pilot-sized cohorts are readily available. Large cohort requests have a minimum 8-week lead time. An estimated lead time will be provided to you within 2-3 business days.
| Age in Weeks | Quantity 1 - 999 |
|---|---|
| 3 to 4 | US$80.00 |
| 5 to 7 | US$96.00 |
| 8 to 10 | US$120.50 |
4007 Male
4007-M Genotype sp/sp
Pilot-sized cohorts are readily available. Large cohort requests have a minimum 8-week lead time. An estimated lead time will be provided to you within 2-3 business days.
| Age in Weeks | Quantity 1 - 999 |
|---|---|
| 3 to 4 | US$80.00 |
| 5 to 7 | US$96.00 |
| 8 to 10 | US$120.50 |
Pricing - EUR Nonprofit
Murine Pathogen Free (MPF) Health Standard
4007 Female
4007-F Genotype sp/sp
Pilot-sized cohorts are readily available. Large cohort requests have a minimum 8-week lead time. An estimated lead time will be provided to you within 2-3 business days.
| Age in Weeks | Quantity 1 - 999 |
|---|---|
| 3 to 4 | 71,75 € |
| 5 to 7 | 86,50 € |
| 8 to 10 | 108,75 € |
4007 Male
4007-M Genotype sp/sp
Pilot-sized cohorts are readily available. Large cohort requests have a minimum 8-week lead time. An estimated lead time will be provided to you within 2-3 business days.
| Age in Weeks | Quantity 1 - 999 |
|---|---|
| 3 to 4 | 71,75 € |
| 5 to 7 | 86,50 € |
| 8 to 10 | 108,75 € |
Pricing - DKK Nonprofit
Murine Pathogen Free (MPF) Health Standard
4007 Female
4007-F Genotype sp/sp
Pilot-sized cohorts are readily available. Large cohort requests have a minimum 8-week lead time. An estimated lead time will be provided to you within 2-3 business days.
| Age in Weeks | Quantity 1 - 999 |
|---|---|
| 3 to 4 | kr.534,25 |
| 5 to 7 | kr.644,00 |
| 8 to 10 | kr.808,75 |
4007 Male
4007-M Genotype sp/sp
Pilot-sized cohorts are readily available. Large cohort requests have a minimum 8-week lead time. An estimated lead time will be provided to you within 2-3 business days.
| Age in Weeks | Quantity 1 - 999 |
|---|---|
| 3 to 4 | kr.534,25 |
| 5 to 7 | kr.644,00 |
| 8 to 10 | kr.808,75 |
Select my Health Standard
Need help choosing the right Taconic Biosciences health standard for your research?
Use the Health Standard Selector to enter your exclusion list. The tool will tell you which health standards meet your requirements.
Get custom pricing guide

Schedule A Scientific Consultation
Connect directly with a member of our Scientific Solutions team who can help you select the most appropriate model and maximize your experimental success.
Related Models


Smart Select Program
Free Animal Model Trial: Quality & Compatibility Assurance
To help alleviate uncertainty in selecting a new model, we offer a free animal trial program that allows you to test the quality, consistency, and availability of Taconic’s rodent models. Pilot our most popular mouse or rat models in your facility at no cost to your organization with the Smart Select program.
- Evaluate a specific model strain, before making any financial investment
- Request up to 20 animals from one of the strains listed here to test for quality, consistency, and suitability for your experimental purpose
- Enjoy free ground shipping, where applicable (see table for more details)