| Model No. | Nomenclature | Genotype |
|---|---|---|
| 129SVE-F | 129S6/SvEvTac | |
| 129SVE-M | 129S6/SvEvTac |
129S6

- Description
- Related Products & Services
- Data
- Growth Chart
- Price & Licensing
- Health Report
- Overview
- Genetics
- Guides & Publications
- Applications & Therapeutic Areas
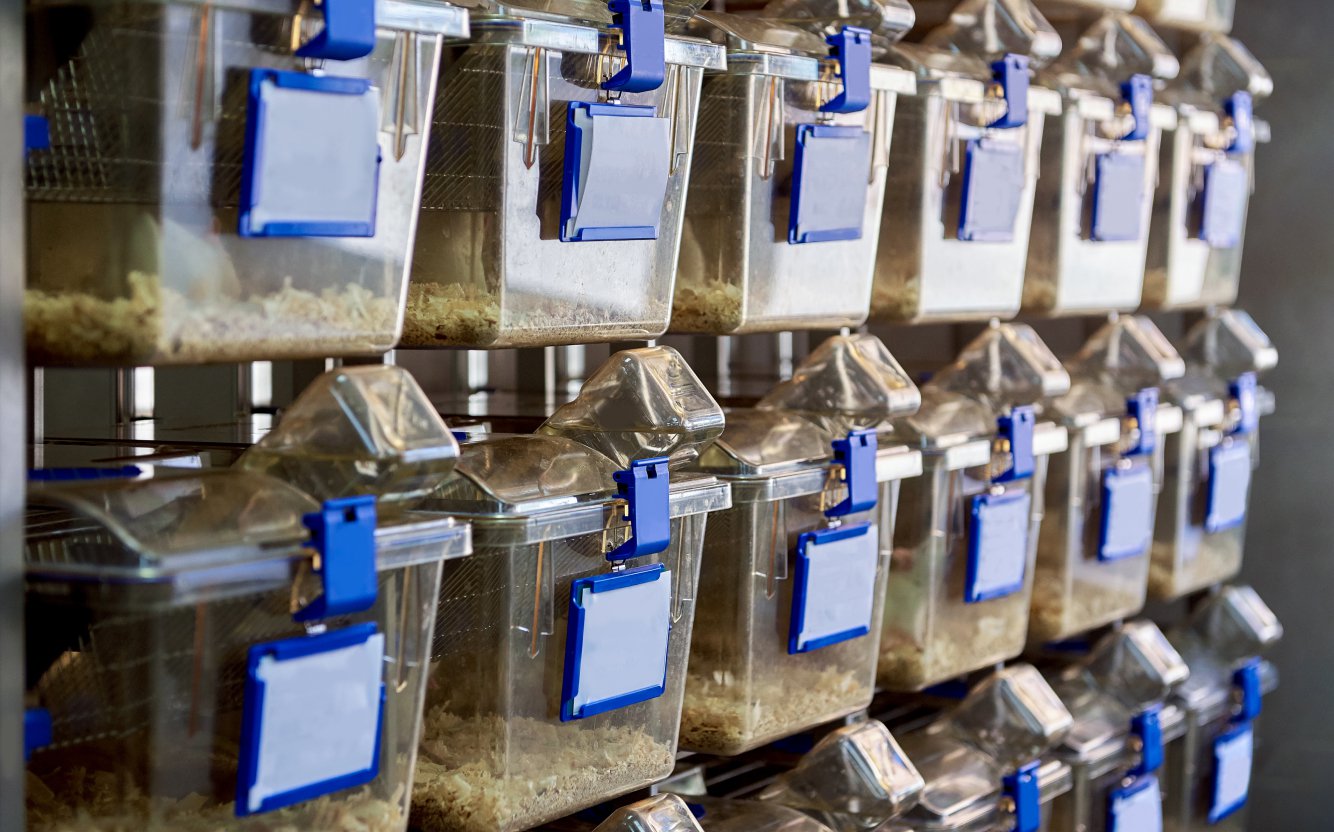
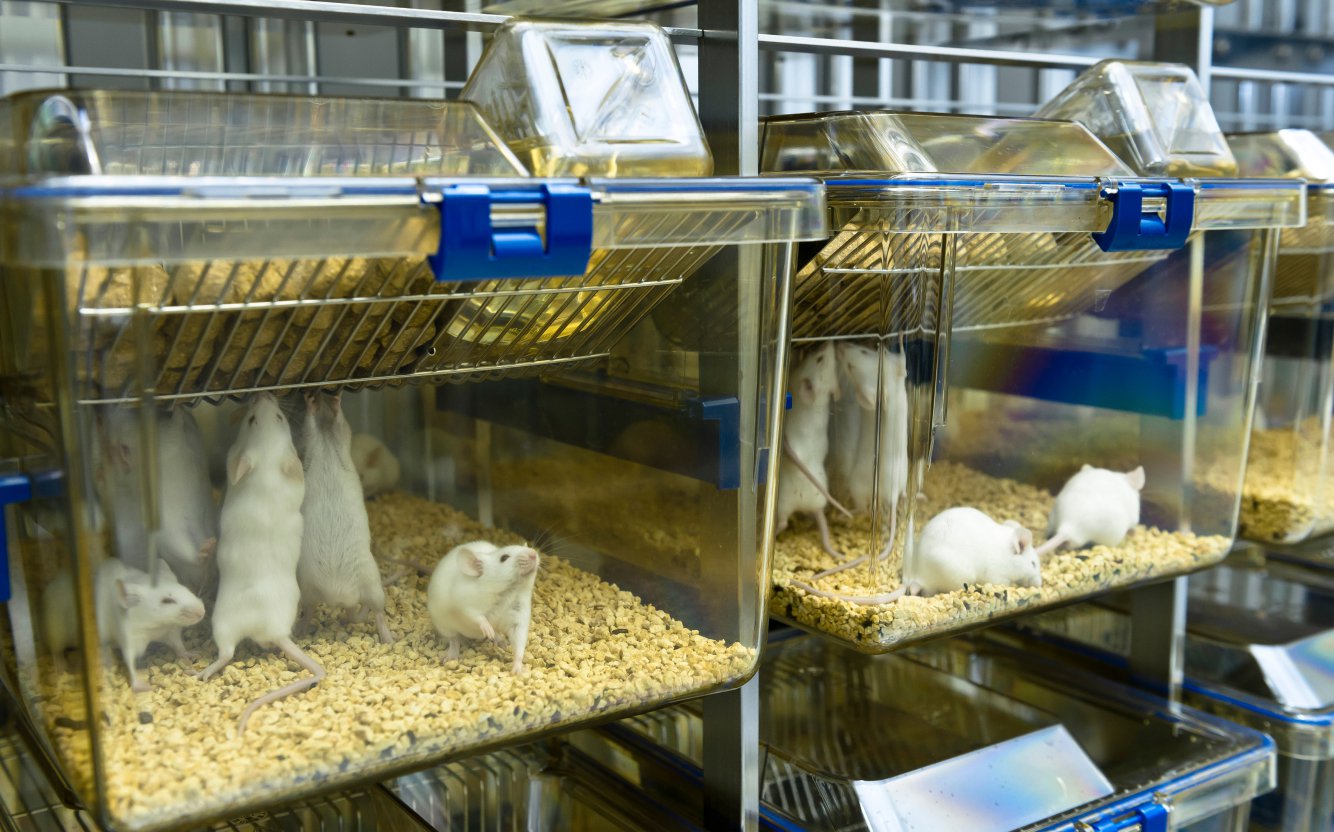
- Transit, Housing & Welfare
- Diet
- Pregnant Mice and Rats Policy
Overview
Nomenclature: 129S6/SvEvTac
- Progenitors of this strain used extensively to establish Embryonic Stem (ES) cell lines (e.g., W4) for the production of targeted mutation (knockout) mice
- Targeted mutation mice developed from 129 agouti ES cell lines can often be maintained with maximum genomic homozygosity by mating chimeras to the 129S6 strain
- Taconic's 129 mice are of the Steel ('S') subline.
Origin
Taconic received 129S6 inbred model stock from GenPharm International from two sublines originating from Dr. Martin Evan's colony in 1992. The mice were derived by embryo transfer in 1993. The resulting offspring were heterozygous at Gpi1 for the 'a' and 'c' alleles. Homozygous Gpi-1c brother x sister mice were selected in the Foundation Colony at F8 and became the common ancestors for all subsequent Taconic breeders. The Taconic foundation colony was at F42 in 2005.
Genetics
Guides & Publications
Initial Publication:
Simpson, EM, et. al; (1997) "Genetic Variation Among 129 substrains and its Importance for 'Targeted Mutagenesis' in Mice." Nature Genetics; Vol. 16(1), p. 19
Applications & Therapeutic Areas
- Immunology
- Inflammation
- Model Generation Solutions
- Neuroscience
- Oncology & Immuno-Oncology
- Psychiatric Disorders
Transit, Housing & Welfare
Need more info? Click the live chat button or Contact Us
Packing Practices
Taconic standard practice is to recombine animals of different home cages and/or ages from a single model and sex during packing, except in specific cases where Taconic's animal welfare policy prohibits recombination due to aggression or other concerns. When an order is fulfilled with animals from more than one week of birth, this standard practice results in animals from a range of birth weeks packed together in a single TTC. When an order is fulfilled with animals from genotyped models, this standard practice results in animals from different home cages packed together in a single TTC.
Customers who wish to keep animals from different weeks of birth separated should place orders with the special instruction "Divide and label by age." Note that this special request can result in increased costs for additional Taconic Transit Cages, dividers and/or freight charges.
Taconic discourages other types of custom packing requests as they can have a negative impact on animal welfare. Learn more.
Diet
Pregnant Mice and Rats Policy
Taconic's breeding specialists use proven, highly effective procedures to generate timed pregnant mice and rats. While gestational age cannot be determined with total precision, strict adherence to pre-defined mating procedures, and close monitoring of female mice and rats after they are co-housed with males, can accurately define the 24-hour period during which mating, and presumably, conception occurs.
Procedures
- At Taconic, the day of sperm cell detection in females is called the sperm-positive date and is considered Day 1 of gestation.
- After co-housing females with males the prior day, Taconic technicians take vaginal swabs of females between 7 and 10 a.m. daily or do plug checks, depending on the model to confirm that mating has occurred. This procedure assumes that timed-pregnant females have mated and conception has occurred from 0 to 24 hours before the designated sperm-positive date.
- Presumably, the majority of matings occur around the midpoint of the previous day's dark cycle, from 6 P.M. to 6 A.M.
- When investigators order timed-pregnant animals at a specified developmental age for delivery on a specific date, Taconic technicians select animals based on the sperm-positive date. For instance, for an order for rats bearing embryos at Day 15 of gestational age for delivery on January 15, Taconic would select timed-pregnant females with a sperm-positive date of January 1.
- Since Taconic's method for selecting timed-pregnant females results in full-term pregnancies with a high success rate as evidenced by the chart below, extra mice and rats are not supplied with each order. However, spontaneous abortions and small litters do occur on occasion. In addition, animals under 14 days do not allow for a visual confirmation of pregnancy and cannot be palpated to confirm pregnancy. When expending considerable time and resources to prepare for a study using timed-pregnant mice or rats on a specific day, and especially when requiring a specific number of pups to be born on a particular day or using a small number of dams or fetuses, please be sure to order additional animals. Please see the chart below to assist in determining the appropriate number of animals to order for your study.
Tips for Ordering
- Specify the sperm-positive date when ordering timed pregnant models.
- Taconic advises customers to order extra timed pregnant animals to prevent any potential issues.
Pregnant Animal Recommendations and Policies
- Taconic's Timed Pregnant Sprague Dawley® rats exhibit greater than 95% accuracy for timing of gestational age. Taconic recommends orders for pregnant mice be less than 18 days gestation, and orders for pregnant rats be less than 19 days in order to prevent the animals from delivering in transit.
Model Type Under 14 days Gestation 14+ days Gestation SD Rats 95% 100% Outbred Mice 75% 100% Inbred Mice 60% 75% - If problems regarding gestational age or pregnancy with timed pregnant orders, customers should immediately contact Taconic's Customer Service Department to provide information regarding the number of animals involved and how non-pregnancy or mistiming was determined. Whenever possible, necropsy information and pictures should be provided to assist complaint investigations for a root cause. Taconic will issue the appropriate credit based on our investigation.
- All untimed pregnant orders are filled using visibly pregnant females selected from Production Colony breeders. Customers should be aware that untimed pregnant mice and rats may deliver their litters while in transit and that no assurances are given regarding the size of the litter.
- Services
Data
Average litter size: 8
Phenotyping Procedures:
129SVE Physiological Data Summary (May 2003; N=10/group):
| Parameter | Units | 129SVE Males | 129SVE Females |
|---|---|---|---|
| Serum Chemistry | Avg ± S.D. | ||
| Calcium | mg/dL | 11.8 ± 0.5 | 10.7 ± 0.6 |
| Phosphorous | mg/dL | 11.9 ± 1.9 | 9.9 ± 1.3 |
| Glucose | mg/dL | 120 ± 23 | 98 ± 18 |
| Creatinine | mg/dL | 0.2 ± 0.1 | 0.1 ± 0.0 |
| BUN | mg/dL | 31 ± 10 | 20 ± 2 |
| Total Bilirubin | mg/dL | 0.1 ± 0.1 | 0.1 ± 0.0 |
| ALK | U/L | 199 ± 34 | 233 ± 25 |
| ALT U/L | U/L | 19 ± 5 | 36 ± 38 |
| Total Protein | g/dL | 5.8 ± 0.2 | 5.3 ± 0.2 |
| Blood Counts | |||
| Erythron | |||
| Red Blood Cells | X10^6/uL | 10.043 ± 0.335 | 9.4725 ± 0.6297 |
| Nucleated RBC | X10^6/uL | 0 ± 0 | 0 ± 0 |
| Hemoglobin | g/dL | 16.7 ± 0.5 | 15.9 ± 0.7 |
| Hematocrit | % | 52.9 ± 1.5 | 49.0 ± 2.1 |
| MCV | fL | 53 ± 1 | 52 ± 2 |
| MCH | pG | 16.7 ± 0.2 | 16.8 ± 0.5 |
| MCHC | % | 31.6 ± 0.3 | 32.4 ± 0.7 |
| Platelets | |||
| Platelets | X10^3/uL | 799 ± 97 | 765 ± 59 |
| Leukogram | |||
| White Blood Cells | x10^3/uL | 5.93 ± 0.60 | 5.30875 ± 1.22240 |
| Neutrophil | x10^3/uL | 0.571 ± 0.285 | 0.639 ± 0.307 |
| Bands | x10^3/uL | 0 ± 0 | 0 ± 0 |
| Lymphocyte | x10^3/uL | 5.174 ± 0.541 | 4.473 ± 1.131 |
| Monocytes | x10^3/uL | 0.168 ± 0.088 | 0.124 ± 0.085 |
| Eosinophil | x10^3/uL | 0.012 ± 0.025 | 0.073 ± 0.090 |
| Basophils | x10^3/uL | 0.0062 ± 0.0196 | 0 ± 0 |
| Others | x10^3/uL | 0 ± 0 | 0 ± 0 |
| Organ Weights | |||
| Stomach | g | 0.236 ± 0.038 | 0.22 ± 0.03 |
| Ileum | g | 0.630 ± 0.064 | 0.59 ± 0.13 |
| Colon | g | 0.127 ± 0.027 | 0.13 ± 0.02 |
| Lungs | g | 0.227 ± 0.024 | 0.19 ± 0.02 |
| Heart | g | 0.156 ± 0.026 | 0.12 ± 0.01 |
| Liver | g | 0.859 ± 0.064 | 0.70 ± 0.11 |
| Spleen/Pancreas | g | 0.199 ± 0.029 | 0.17 ± 0.02 |
| Kidney (L) | g | 0.164 ± 0.017 | 0.11 ± 0.01 |
| Kidney (R) | g | 0.154 ± 0.012 | 0.11 ± 0.01 |
| Testes (L) | g | 0.091 ± 0.025 | - |
| Testes (R) | g | 0.101 ± 0.018 | - |
| Ovary (L) | g | - | 0.01 ± 0.01 |
| Ovary (R) | g | - | 0.02 ± 0.03 |
| Urinalysis | |||
| Glucose | mg/dL | Neg. | Neg. |
| Blood | - | Neg. | Neg. |
| Ph | - | 6.3 ± 0.3 | 6.4 ± 0.2 |
| Protein | mg/dL | Trace | Trace |
| Specific Gravity | - | 1.026 ± 0.004 | 1.016 ± 0.008 |
Animal Receipt and Maintenance
A quantity of twenty mice (ten males and ten females) was submitted for testing, strain identified as Line 129SVE (129S6/SvEvTac), age 7 weeks. Mice were received at RBU 3, Taconic Biotechnology, Albany NY and acclimated for three days on irradiated NIH #31M rodent diet and sterilized water ad lib, sterile contact bedding (paper chip) and a 12:12 light:dark cycle. All animals appeared normal during this period and routine health surveillance of this colony detected no microbial pathogens. Mice were assigned study unique identification numbers (males 1-10, females 11-20).
Urinalysis
All mice were fasted in metabolic cages and an overnight urine sample was collected. Urine analysis was performed using Multistix 10 SG (Bayer). Strips were read and recorded as per the manufacturer's instructions, and the results are presented in Table 1.
Clinical Chemistry and Hematology
A terminal blood sample was taken from Carbon Dioxide - anesthetized mice via cardiac puncture. The collected blood was divided into two samples. One sample was treated with EDTA and stored at 4°C for hematological evaluation. Another sample was allowed to clot at 4°C for 30 minutes, and then centrifuged at 7000rpm for 10 minutes, and the serum was decanted and frozen at -80°C for clinical chemistry analysis. A slide smear was made from a single drop of whole blood. Frozen serum, chilled whole blood, and slides were delivered to LabCorp (RTP, NC) for analysis; the results are presented in Table 2. Unless otherwise indicated, serum chemistry data is generated from a Hitachi 717 automated analyzer and hematological data is generated from a Celldyne 3500. WBC differential counts are performed manually. No blood samples were obtained from mouse #16.
Necropsy and Organ Weights
All mice were euthanized and bodyweights were recorded. Representative tissues were collected, weighed, and immersion fixed in 10% Neutral Buffered Formalin. Tissues were delivered to the Taconic lab for histological preparation and evaluation. Tabulation of organ weights is presented in Table 3. The pathologist's summary and detailed histological descriptions follow.
Model 129SVE (strain: 129S6/SvEvTac) Reproductive Data:
Summary: The Average Female Breeder 1 produces a litter of 6.4 pups every 5.4 weeks
| Criteria | Average | Std.Dev | Low | High | N= |
| Newborn Litter Size | 6.3 | 0.88 | 1 | 11 | 112 |
| Weaned Litter Size | 6.4 | 0.93 | 2 | 11 | 107 |
| Weeks from Setup to 1st Litter | 3.7 | 0.5 | 3 | 4 | 25 |
| # of Weeks Breeders Productive 2) | 23 | 8 | 5 | 34 | 25 |
| Features | % | N= |
| % of Breeder Pairs Not Producing A Litter (i.e. possible sterility) | 0.0% | 25 pairs |
| % of Entire Litters Cannibalized | 5.1% | 118 litters |
| Newborn Mortality (excluding Entire Litter Cannibalism) | 3.1% | 709 newborns |
| Females as % of Total Weanlings (Sex Ratio) | 54% | 687 weanlings |
| Active Breeder Production Efficiency Index (PEI) | 1.19 | 576 Breeder Weeks |
| 1st Litter - Entire Litter Cannibalism Rate | 4.0% | 25 litters |
| 1st Litter - Newborn Mortality (excluding Entire Litter Cannibalism) | 7.7% | 143 newborns |
- Criteria for Retiring an Active Breeder: No litter or pregnancy observed within six weeks of breeder setup date. Breeder has two consecutive lost litters. Breeder has two consecutive litters of less than 2-3 pups. Breeder found moribund. Breeders generally scheduled for teardown after 30-34 weeks of active breeding
- Maximum allowed breeder age in Taconic's commercial Production colonies is generally 30-34 weeks
For some applications, weight may be critical. For orders where weight is critical, please place orders by weight, not by age. Taconic can accept orders by weight for this model. For orders sourced from US or Denmark a production minimum 3 gram span is accepted. All weights are weights at time of packing. Mice and rats can lose weight in transit. Orders for specific weight spans will be assessed a nominal fee. More detail on weight order policies is available.
n = 250 per sex at MPF and RF health standards from all global colonies.
High and Low represent mean +/- 2 standard deviations.
Based on sample size the charts above represent ~90% of the population.
All growth curves represent animals housed in our barriers, at our standard density and fed NIH31-M diet. Variations at customer facilities will alter expected growth curves.
Growth charts are provided only as a guide, if a specific weight criteria is needed please order animals by weight.
Customize this chart by clicking the legend elements.
- Licensing
- Pricing - USD
- Pricing - EUR
- Pricing - DKK
- Pricing - USD Nonprofit
- Pricing - EUR Nonprofit
- Pricing - DKK Nonprofit
- Select my Health Standard
- Get Custom Pricing Guide
Licensing
Terms of Sale and Use for 129S6
These models are sold subject to Taconic's Terms and Conditions for Taconic's Models, Products and Services
Pricing - USD
Murine Pathogen Free (MPF) Health Standard
129SVE Female
129SVE-F
Available now
| Age in Weeks | Quantity 1 - 999 |
|---|---|
| 3 to 4 | US$48.00 |
| 5 to 7 | US$56.50 |
| 8 to 10 | US$68.25 |
Specialized Inventory
| 129SVE-FL | Quantity 1 - 199 |
|---|---|
| female with litter | US$312.25 |
Specialized Inventory
| 129SVE-RF | Quantity 1 - 199 |
|---|---|
| retired female breeder | US$79.00 |
129SVE Male
129SVE-M
Available now
| Age in Weeks | Quantity 1 - 999 |
|---|---|
| 3 to 4 | US$48.00 |
| 5 to 7 | US$56.50 |
| 8 to 10 | US$68.25 |
Specialized Inventory
| 129SVE-RM | Quantity 1 - 199 |
|---|---|
| retired male breeder | US$74.50 |
Opportunist Free (OF) Health Standard
129SVE Female
129SVE-F
Available now
| Age in Weeks | Quantity 1 - 999 |
|---|---|
| 3 to 4 | US$63.00 |
| 5 to 7 | US$72.50 |
| 8 to 10 | US$90.50 |
Specialized Inventory
| 129SVE-RF | Quantity 1 - 199 |
|---|---|
| retired female breeder | US$101.25 |
129SVE Male
129SVE-M
Cohorts are reserved upon order placement and will take 2-4 weeks to fulfill. An estimated lead time will be provided to you within 2-3 business days.
| Age in Weeks | Quantity 1 - 999 |
|---|---|
| 3 to 4 | US$63.00 |
| 5 to 7 | US$72.50 |
| 8 to 10 | US$90.50 |
Specialized Inventory
| 129SVE-RM | Quantity 1 - 199 |
|---|---|
| retired male breeder | US$101.25 |
Pricing - EUR
Murine Pathogen Free (MPF) Health Standard
129SVE Female
129SVE-F
Available now
| Age in Weeks | Quantity 1 - 999 |
|---|---|
| 3 to 4 | 43,25 € |
| 5 to 7 | 50,75 € |
| 8 to 10 | 61,25 € |
Specialized Inventory
| 129SVE-FL | Quantity 1 - 199 |
|---|---|
| female with litter | 282,00 € |
Specialized Inventory
| 129SVE-RF | Quantity 1 - 199 |
|---|---|
| retired female breeder | 70,75 € |
129SVE Male
129SVE-M
Available now
| Age in Weeks | Quantity 1 - 999 |
|---|---|
| 3 to 4 | 43,25 € |
| 5 to 7 | 50,75 € |
| 8 to 10 | 61,25 € |
Specialized Inventory
| 129SVE-RM | Quantity 1 - 199 |
|---|---|
| retired male breeder | 67,50 € |
Opportunist Free (OF) Health Standard
129SVE Female
129SVE-F
Available now
| Age in Weeks | Quantity 1 - 999 |
|---|---|
| 3 to 4 | 57,00 € |
| 5 to 7 | 65,50 € |
| 8 to 10 | 81,25 € |
Specialized Inventory
| 129SVE-RF | Quantity 1 - 199 |
|---|---|
| retired female breeder | 90,75 € |
129SVE Male
129SVE-M
Cohorts are reserved upon order placement and will take 2-4 weeks to fulfill. An estimated lead time will be provided to you within 2-3 business days.
| Age in Weeks | Quantity 1 - 999 |
|---|---|
| 3 to 4 | 57,00 € |
| 5 to 7 | 65,50 € |
| 8 to 10 | 81,25 € |
Specialized Inventory
| 129SVE-RM | Quantity 1 - 199 |
|---|---|
| retired male breeder | 90,75 € |
Pricing - DKK
Murine Pathogen Free (MPF) Health Standard
129SVE Female
129SVE-F
Available now
| Age in Weeks | Quantity 1 - 999 |
|---|---|
| 3 to 4 | kr.322,00 |
| 5 to 7 | kr.377,00 |
| 8 to 10 | kr.456,00 |
Specialized Inventory
| 129SVE-FL | Quantity 1 - 199 |
|---|---|
| female with litter | kr.2.096,75 |
Specialized Inventory
| 129SVE-RF | Quantity 1 - 199 |
|---|---|
| retired female breeder | kr.525,75 |
129SVE Male
129SVE-M
Available now
| Age in Weeks | Quantity 1 - 999 |
|---|---|
| 3 to 4 | kr.322,00 |
| 5 to 7 | kr.377,00 |
| 8 to 10 | kr.456,00 |
Specialized Inventory
| 129SVE-RM | Quantity 1 - 199 |
|---|---|
| retired male breeder | kr.502,50 |
Opportunist Free (OF) Health Standard
129SVE Female
129SVE-F
Available now
| Age in Weeks | Quantity 1 - 999 |
|---|---|
| 3 to 4 | kr.424,50 |
| 5 to 7 | kr.486,75 |
| 8 to 10 | kr.605,00 |
Specialized Inventory
| 129SVE-RF | Quantity 1 - 199 |
|---|---|
| retired female breeder | kr.675,75 |
129SVE Male
129SVE-M
Cohorts are reserved upon order placement and will take 2-4 weeks to fulfill. An estimated lead time will be provided to you within 2-3 business days.
| Age in Weeks | Quantity 1 - 999 |
|---|---|
| 3 to 4 | kr.424,50 |
| 5 to 7 | kr.486,75 |
| 8 to 10 | kr.605,00 |
Specialized Inventory
| 129SVE-RM | Quantity 1 - 199 |
|---|---|
| retired male breeder | kr.675,75 |
Pricing - USD Nonprofit
Murine Pathogen Free (MPF) Health Standard
129SVE Female
129SVE-F
Available now
| Age in Weeks | Quantity 1 - 999 |
|---|---|
| 3 to 4 | US$48.00 |
| 5 to 7 | US$56.50 |
| 8 to 10 | US$68.25 |
Specialized Inventory
| 129SVE-FL | Quantity 1 - 199 |
|---|---|
| female with litter | US$312.25 |
Specialized Inventory
| 129SVE-RF | Quantity 1 - 199 |
|---|---|
| retired female breeder | US$79.00 |
129SVE Male
129SVE-M
Available now
| Age in Weeks | Quantity 1 - 999 |
|---|---|
| 3 to 4 | US$48.00 |
| 5 to 7 | US$56.50 |
| 8 to 10 | US$68.25 |
Specialized Inventory
| 129SVE-RM | Quantity 1 - 199 |
|---|---|
| retired male breeder | US$74.50 |
Opportunist Free (OF) Health Standard
129SVE Female
129SVE-F
Available now
| Age in Weeks | Quantity 1 - 999 |
|---|---|
| 3 to 4 | US$63.00 |
| 5 to 7 | US$72.50 |
| 8 to 10 | US$90.50 |
Specialized Inventory
| 129SVE-RF | Quantity 1 - 199 |
|---|---|
| retired female breeder | US$101.25 |
129SVE Male
129SVE-M
Cohorts are reserved upon order placement and will take 2-4 weeks to fulfill. An estimated lead time will be provided to you within 2-3 business days.
| Age in Weeks | Quantity 1 - 999 |
|---|---|
| 3 to 4 | US$63.00 |
| 5 to 7 | US$72.50 |
| 8 to 10 | US$90.50 |
Specialized Inventory
| 129SVE-RM | Quantity 1 - 199 |
|---|---|
| retired male breeder | US$101.25 |
Pricing - EUR Nonprofit
Murine Pathogen Free (MPF) Health Standard
129SVE Female
129SVE-F
Available now
| Age in Weeks | Quantity 1 - 999 |
|---|---|
| 3 to 4 | 43,25 € |
| 5 to 7 | 50,75 € |
| 8 to 10 | 61,25 € |
Specialized Inventory
| 129SVE-FL | Quantity 1 - 199 |
|---|---|
| female with litter | 282,00 € |
Specialized Inventory
| 129SVE-RF | Quantity 1 - 199 |
|---|---|
| retired female breeder | 70,75 € |
129SVE Male
129SVE-M
Available now
| Age in Weeks | Quantity 1 - 999 |
|---|---|
| 3 to 4 | 43,25 € |
| 5 to 7 | 50,75 € |
| 8 to 10 | 61,25 € |
Specialized Inventory
| 129SVE-RM | Quantity 1 - 199 |
|---|---|
| retired male breeder | 67,50 € |
Opportunist Free (OF) Health Standard
129SVE Female
129SVE-F
Available now
| Age in Weeks | Quantity 1 - 999 |
|---|---|
| 3 to 4 | 57,00 € |
| 5 to 7 | 65,50 € |
| 8 to 10 | 81,25 € |
Specialized Inventory
| 129SVE-RF | Quantity 1 - 199 |
|---|---|
| retired female breeder | 90,75 € |
129SVE Male
129SVE-M
Cohorts are reserved upon order placement and will take 2-4 weeks to fulfill. An estimated lead time will be provided to you within 2-3 business days.
| Age in Weeks | Quantity 1 - 999 |
|---|---|
| 3 to 4 | 57,00 € |
| 5 to 7 | 65,50 € |
| 8 to 10 | 81,25 € |
Specialized Inventory
| 129SVE-RM | Quantity 1 - 199 |
|---|---|
| retired male breeder | 90,75 € |
Pricing - DKK Nonprofit
Murine Pathogen Free (MPF) Health Standard
129SVE Female
129SVE-F
Available now
| Age in Weeks | Quantity 1 - 999 |
|---|---|
| 3 to 4 | kr.322,00 |
| 5 to 7 | kr.377,00 |
| 8 to 10 | kr.456,00 |
Specialized Inventory
| 129SVE-FL | Quantity 1 - 199 |
|---|---|
| female with litter | kr.2.096,75 |
Specialized Inventory
| 129SVE-RF | Quantity 1 - 199 |
|---|---|
| retired female breeder | kr.525,75 |
129SVE Male
129SVE-M
Available now
| Age in Weeks | Quantity 1 - 999 |
|---|---|
| 3 to 4 | kr.322,00 |
| 5 to 7 | kr.377,00 |
| 8 to 10 | kr.456,00 |
Specialized Inventory
| 129SVE-RM | Quantity 1 - 199 |
|---|---|
| retired male breeder | kr.502,50 |
Opportunist Free (OF) Health Standard
129SVE Female
129SVE-F
Available now
| Age in Weeks | Quantity 1 - 999 |
|---|---|
| 3 to 4 | kr.424,50 |
| 5 to 7 | kr.486,75 |
| 8 to 10 | kr.605,00 |
Specialized Inventory
| 129SVE-RF | Quantity 1 - 199 |
|---|---|
| retired female breeder | kr.675,75 |
129SVE Male
129SVE-M
Cohorts are reserved upon order placement and will take 2-4 weeks to fulfill. An estimated lead time will be provided to you within 2-3 business days.
| Age in Weeks | Quantity 1 - 999 |
|---|---|
| 3 to 4 | kr.424,50 |
| 5 to 7 | kr.486,75 |
| 8 to 10 | kr.605,00 |
Specialized Inventory
| 129SVE-RM | Quantity 1 - 199 |
|---|---|
| retired male breeder | kr.675,75 |
Select my Health Standard
Need help choosing the right Taconic Biosciences health standard for your research?
Use the Health Standard Selector to enter your exclusion list. The tool will tell you which health standards meet your requirements.
Get custom pricing guide
Schedule A Scientific Consultation
Connect directly with a member of our Scientific Solutions team who can help you select the most appropriate model and maximize your experimental success.
Smart Select Program
Free Animal Model Trial: Quality & Compatibility Assurance
To help alleviate uncertainty in selecting a new model, we offer a free animal trial program that allows you to test the quality, consistency, and availability of Taconic’s rodent models. Pilot our most popular mouse or rat models in your facility at no cost to your organization with the Smart Select program.
- Evaluate a specific model strain, before making any financial investment
- Request up to 20 animals from one of the strains listed here to test for quality, consistency, and suitability for your experimental purpose
- Enjoy free ground shipping, where applicable (see table for more details)








.jpg)

.jpg)
.jpg)
.jpg)
.jpg)



.jpg)


.jpg)
.jpg)



.jpg)



.jpg)

.jpg)


